Category Archives: TC

TC, Technical Communication

Evolution of a website – Part 1 of 4

Ever wonder how a website changes over time? Let’s take a peek at a website that has been around for years and I share with you four versions of the STC New Mexico Kachina Chapter website. I will also go into the technical details regarding how I implemented the current site.

Before I begin, I wish to thank the previous webmasters for spending countless hours maintaining the previous incarnations of the Kachina Chapter site. Without their effort, the site would not be where it is today without the valuable content that members have contributed.

My discussion will entail how I reached to the website that is today, http://stc-nm-kachina.org. This includes site implementation, page and layout design, website architecture, and content management.

This is a four-part series which I discuss the first two versions of the website pre-WordPress, the third and fourth versions of the site using WordPress, implementation of the fourth version using WordPress and its intricacies, and lastly how to keep the site alive.

Part 1

Versions 1 and 2: pre-WordPress

The history of the site was pretty straightforward until I became webmaster for the Kachina Chapter–previous webmasters either hard-coded from scratch or used a WYSIWYG (what you see is what you get) HTML editor to design and maintain the website. When I arrived as webmaster, the website was bifurcated into two sites: a static HTML website for Chapter content and a blog powered by WordPress–a simple and powerful content management system for blogging and websites. It didn’t help that neither site had the same page and layout design or that some of the static HTML pages linked to much older pages which had a completely different design. Also to note, the blog was not set up correctly for blog posts and it was in a random directory that made it difficult to operate properly.

Imagine having the WordPress blog at http://stc-nm-kachina.org/main/ and the HTML static website at http://stc-nm-kachina.org. It just looks messy and confusing for visitors. Which site or blog would visitors go to?

The first two incarnations of the website utilized static HTML and some CSS. These pages are great if the webmaster doesn’t drastically change the style or design too much. What I like about the old site is that much of the content and color schemes is now used on the current site.

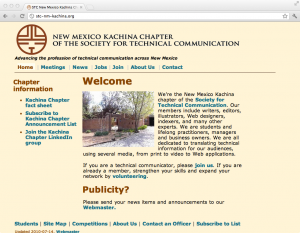
STC NM Kachina Evolution - Version 1

STC NM Kachina Evolution – Version 1

The first version and second version use the same logo and header, yet the color and layout change dramatically. Since I enjoy the second version color scheme, you see this convention used in future versions.

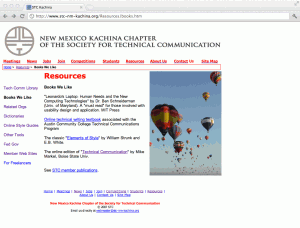
STC NM Kachina Evolution - Version 2

STC NM Kachina Evolution – Version 2


In two weeks, on July 24, 2012 at 11:05 a.m. ET, I will discuss part two of my four-part series. Part two will encompass how I used WordPress to design and support the site.

Twitter experience at the STC 2012 Summit

I was delighted to see Twitter use increase year after year at the STC Summits. At the 56th Annual STC Summit in Atlanta, GA, I co-presented an educational session that talked about this social network. My colleagues who were on Twitter at the time were the earliest adopters of the service; I never imagined how useful it would be three years later at the STC 2012 Summit in Chicago, IL.

Pre-Conference Networking

Before the 2012 Summit started, I tweeted my excitement about attending the STC 2012 Summit in Chicago to meet new and familiar professionals. In addition, I tweeted about my adventure heading into Chicago, which entailed flying across the Plains States from Albuquerque to Chicago. For me, it was my first experience using the internet on an airliner.

Twitter on the plane

Twitter on the plane

Session Tweets

Special thanks go to the coordinators of the STC Summit for arranging internet access at the previous summits. It is a HUGE benefit value to have internet access at the conference hotel to update Twitter and allow readers to follow the #stc12 hash tag.

Throughout the conference, I was able to bring my laptop and see updates from conference attendees who were in other sessions. In some cases, I wish I could be in two places at one time because I kept reading great tweets about Tristan Bishop’s session while attending Jenna Moore’s talk, which was extremely good too.

I also love to read what people have on their minds while at the same session. It was great to engage in conversation during the session. At the same time, I tried to limit the amount of tweets that quoted the presenter during the session. Reflecting from previous conference tweets, I wanted to improve the quality of my posts instead of being “first” to tweet about the presentation. I felt that during the 2011 Summit, I rushed to post and I didn’t get as much out of the presentation because I was distracted with Twitter.

To me, it was a matter of post quality over quantity and I strived to post the best content possible.

Finding People / Providing Information

At the beginning of the conference, I saw Sara Baca’s tweet about her issues logging into the wireless internet. I sent her a direct message with the login details for the WiFi connection. I was able to share that information and she in turn shared that info for others at the summit.

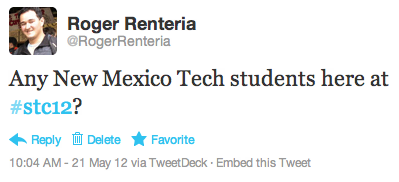
Another example was trying to locate people at the conference. I went to Twitter to find a couple of classmates from my Alma Mater, New Mexico Tech. Kai Weber said he found one of the Techies (nickname for students who attend Tech) and he would try to connect me with the student. What was great is that Kai responded to my message. He happened to monitor the #stc12 feed at the time and surreptitiously found my post.

STC 2012 tweet asking about New Mexico Tech students

STC 2012 tweet asking about New Mexico Tech students

My last example was to find Menno de Jong, Editor of the publication, Technical Communication. I posted to the #stc12 feed asking if anyone saw him. Sara Baca told me he was a neighbor in the hotel but she had not seen him recently. Then @stc_org told me that he would be at the Honors Banquet rehearsal Tuesday at 3:30. When I stopped by the rehearsal, Menno was there. Twitter proved to be a useful resource to find and locate people easily. I believe Menno doesn’t carry his phone or have a Twitter account, so it was possible to locate him through my techcomm Twitter contacts who were attending the conference.

Before I finish, Ben Woelk posted an entry discussing the statistics regarding Twitter Use at #stc12. It is his second year writing about how we use Twitter at the STC Summit. You can check out his post on Twitter at STC 2011 and 2010 for comparison.

One Year Anniversary

I cannot believe it was a year and a few days ago that I came up with the idea to write a blog about my views and interests in the field of technical communication. My first post, Post-STC 2011 Summit, started the journey in which I subsequently discussed QR Codes, Google+, Facebook, MySpace, Professional UsernamesTechWhirl, and many more topics.

To give you an idea of what has been going on behind the scenes, I will share with you some of the numbers from WordPress and Google Analytics since I began this blog and website. Enjoy the data!

The Raw Statistics

(Includes everything, including my own visits)

  • 1621 Visits
  • 956 Unique Visitors
  •  4671 Page Views
  • 58.42% Bounce Rate (single-page visits or visits that resulted in leaving the landing page)
  • 58.67% New Visits

Top Five States With Most Visitors

(excluding New Mexico)

  1. Texas
  2. California
  3. Illinois
  4. New York
  5. Massachusetts

Top Nine U.S. Cities With Most Visitors

(excluding Albuquerque, NM)

  1. Chicago, IL
  2. Austin, TX
  3. Minneapolis, MN
  4. Espanola, NM
  5. Santa Fe, NM
  6. New York, NY
  7. Los Angeles, CA
  8. Springfield, MO
  9. Dallas, TX

Top Five Countries With Longest Average Visit Duration

(excluding the United States)

  1. New Zealand (9:08 min)
  2. Antigua and Barbuda (2:00 min)
  3. Latvia (1:32 min)
  4. Singapore (1:25 min)
  5. India (1:08 min)

This is a small sampling of the data I collected. There is much more insight, such as types of internet browser, versions of operating system, type of internet service provider used to visit the site, etc.

Basically, when I looked at the data, I saw that I had the most readers from the United States and several from around the world. Visitors came in all forms, using Windows XP, Vista, or 7 or Mac OS X; Firefox, Chrome, or Internet Explorer; and iPhones, iPads, or Android tablets. Of visitors viewing the site, about 31% used a 1280 x 800 screen resolution, 11% used a 1680 x 1050 resolution, 9% used 1366 x 768 resolution, and the remaining used a mix of other screen resolutions.

These sorts of data can be very useful when deciding how to design websites for specific audiences and what kind of browsers and devices I should consider when building sites. I am a data geek, so it is really neat to look into the numbers and capture a glimpse of who my audience is.

I analyzed more of the data, and I have some goals that I want to accomplish in the next year:

  1. Increase Average Visit Duration
  2. Reduce Bounce Rate
  3. Increase Returning Visitors
  4. Increase Website Referrals
  5. Reduce Site Drop Offs
  6. Increase Post Comments

Think it can be done? Anything is possible. I will share more blog entries on my social networks in hopes colleagues will read them. Also, I will research more Search Engine Optimization (SEO) techniques so visitors can find my site easily using Google, Bing, or Yahoo.

I really look forward to comparing this year’s data to next year’s and see the differences.